


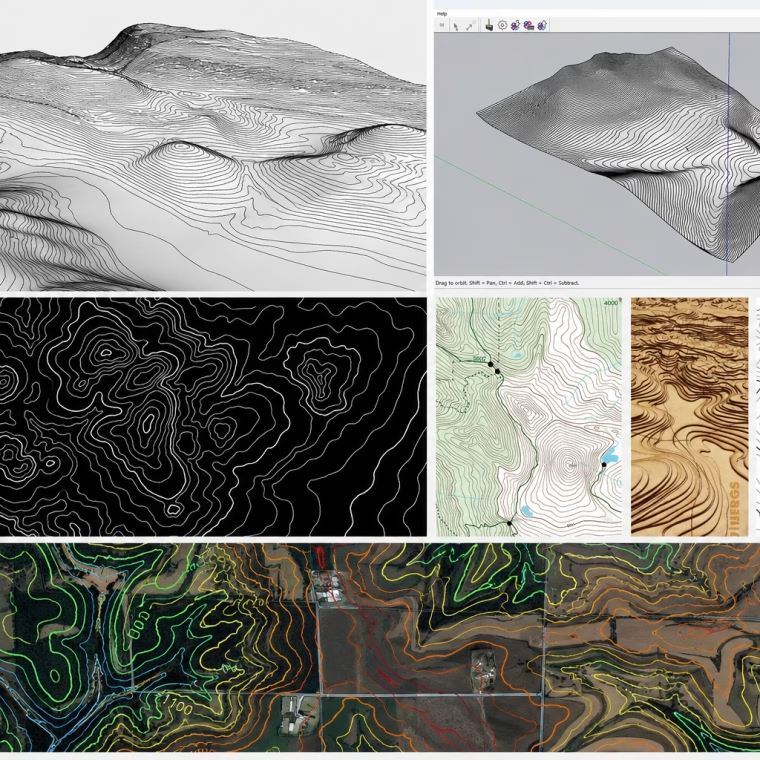

Whether you’re a geography student, a homeowner trying to make sense of a site plan, or a developer assessing land for a new project, understanding contour lines puts you in a much stronger position. This guide covers everything you need to know, from the basic rules to how contour data shapes real engineering decisions on residential sites across the UK.
🧩 What Are Contour Lines?
A contour line, sometimes called a topo line, topography line, or contouring line, is a line drawn on a map that joins all points sharing the same elevation above a reference datum (usually Ordnance Datum Newlyn in the UK, which corresponds to mean sea level). Every single point that sits on a given contour line is at the same height above that datum, even if those points are miles apart on the ground.
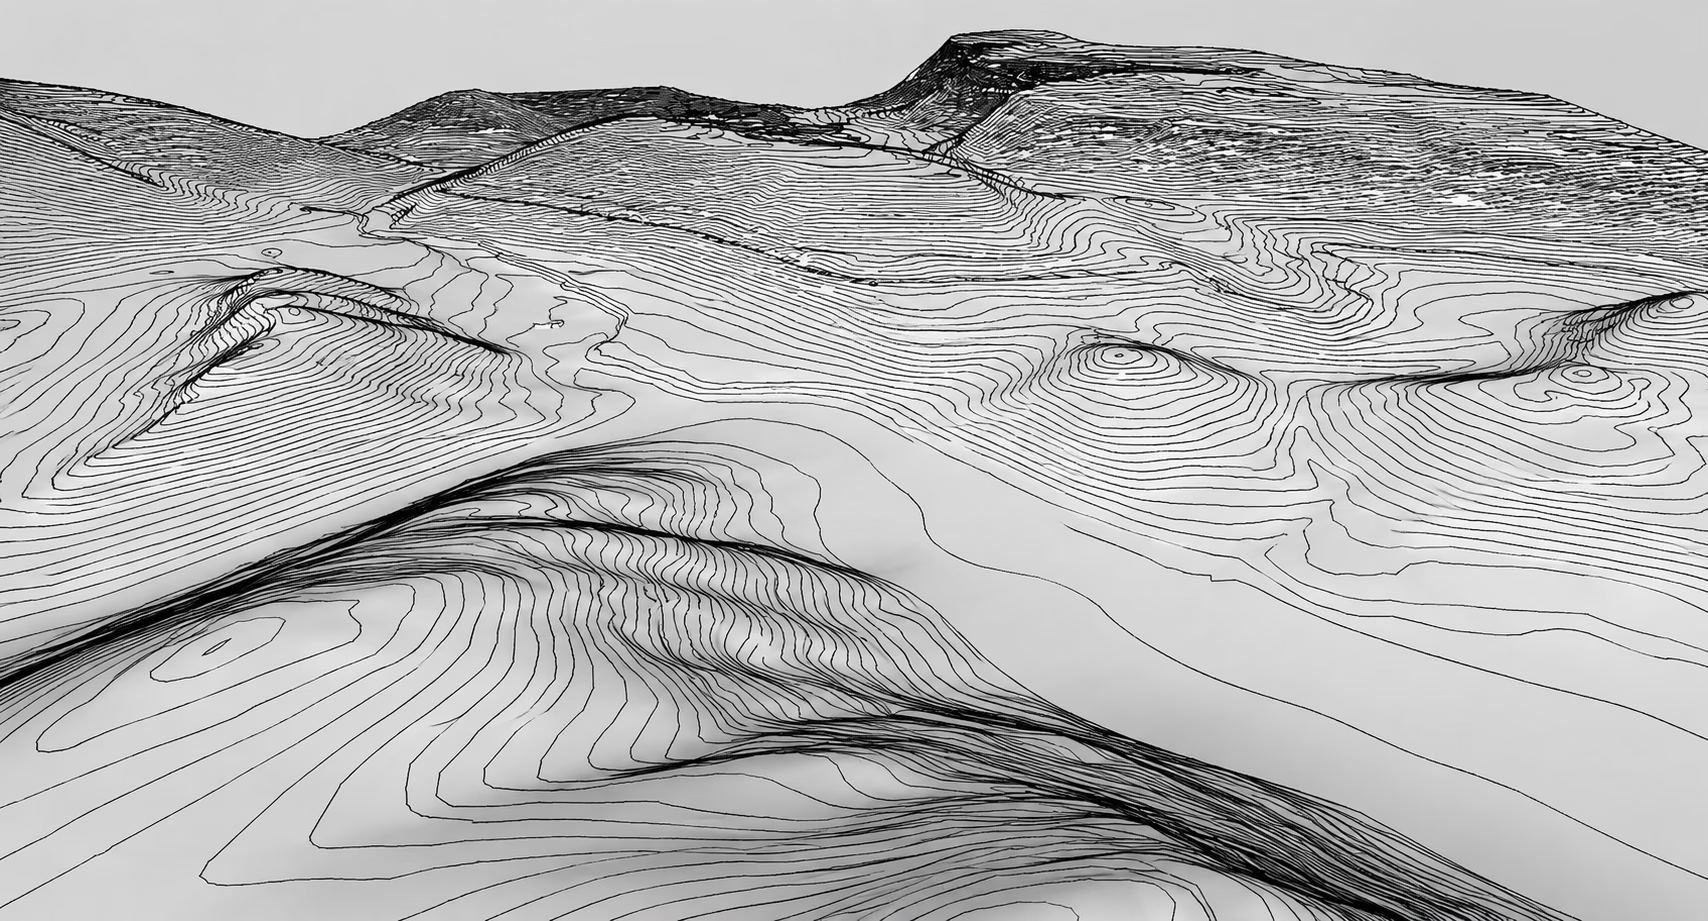
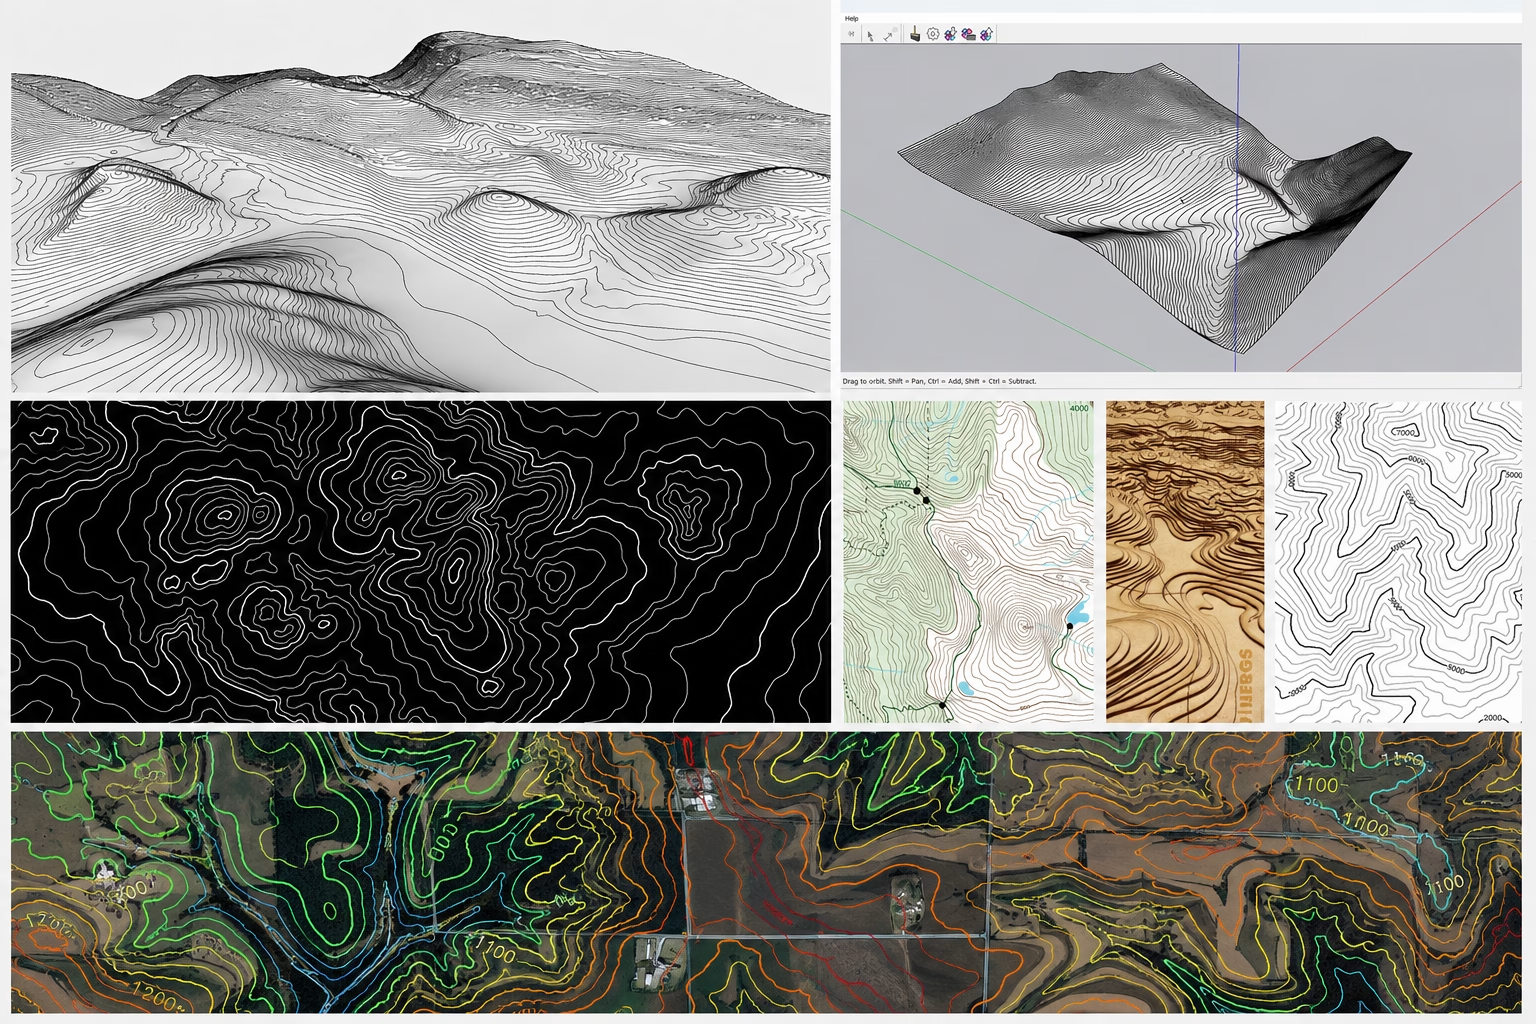
The real power of contour lines is that they let cartographers and engineers represent a three-dimensional landscape on a two-dimensional surface. By looking at how the lines are arranged, how many there are, how closely they’re packed, and what shapes they form, you can picture the actual shape of the land without ever setting foot on it.
In short: a contour line shows you where the land sits at a specific height, and a map of contour lines shows you how the whole terrain rises and falls across an area.
🧩 The Main Types of Contour Lines
Not all contour lines on a map are the same. Most topographic maps use three main types, each serving a slightly different purpose.
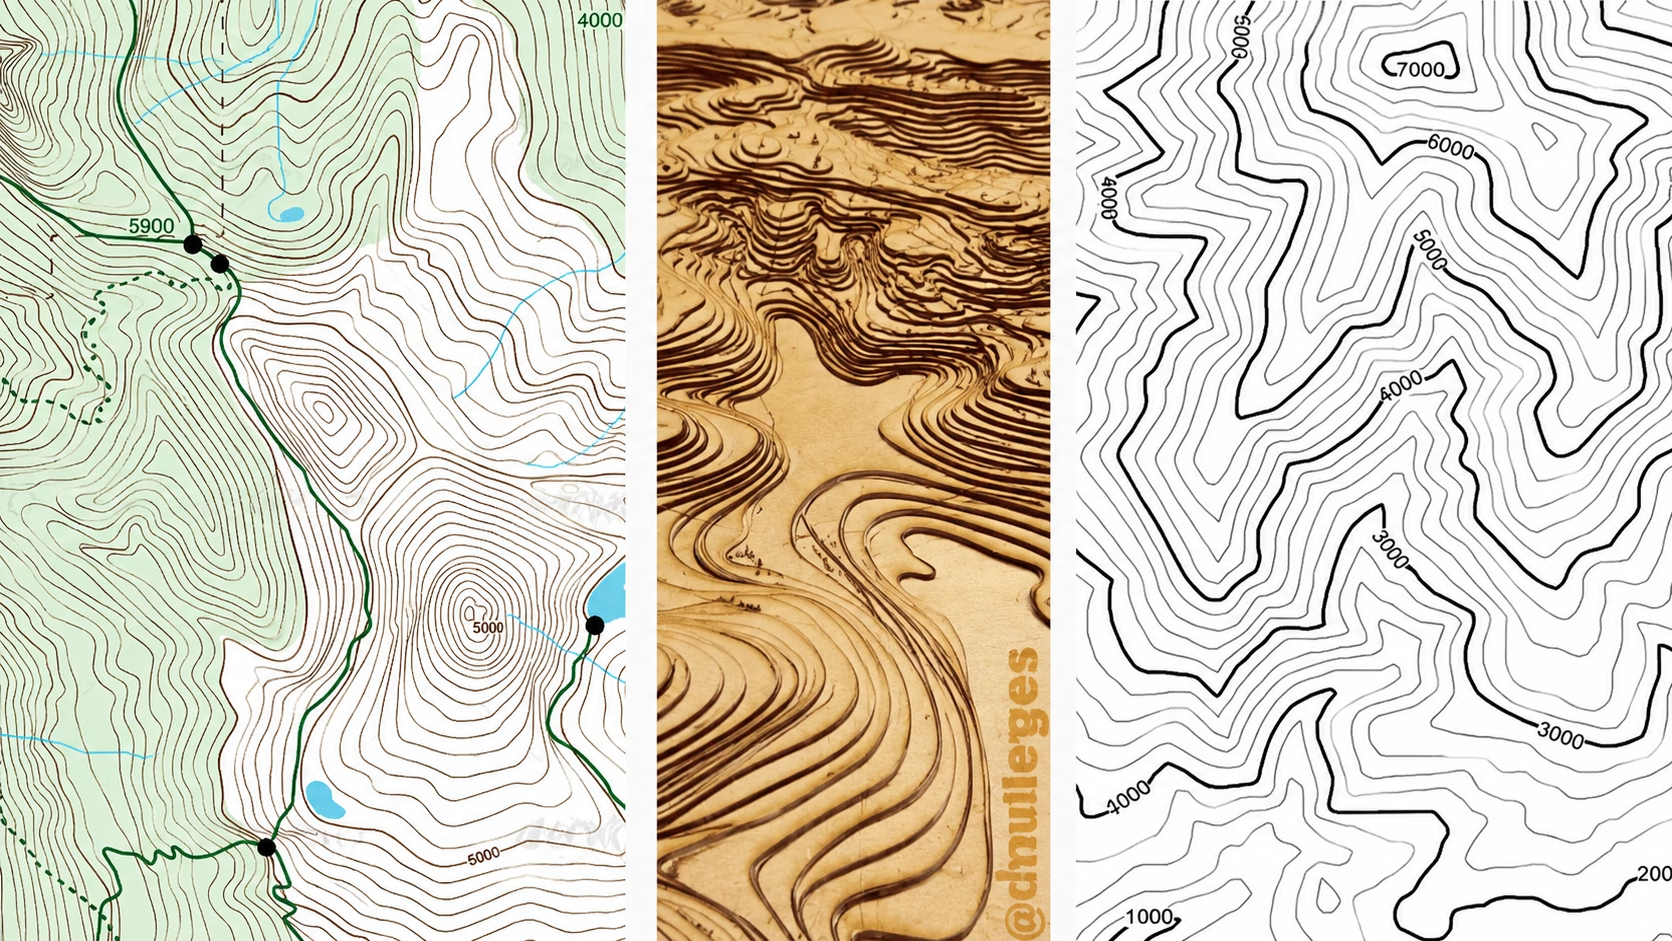
Index contours are the bolder, darker lines printed at regular intervals, typically every fifth contour, and they carry a labelled elevation value. These are your anchoring points: find a number on an index contour and you immediately know the exact height of that line. Intermediate contours are the standard, lighter-weight lines drawn between index contours. They don’t carry a number, but their spacing relative to the index contours tells you how the terrain changes in finer detail. Supplementary contours (also called form contours) are dashed lines added on very flat terrain where the standard contour interval would leave too large a gap to be useful — they give a more accurate picture of subtle undulations that would otherwise be invisible.
Beyond these three, it’s worth knowing that contour lines belong to a broader family of map lines called isopleths, lines that connect points of equal value. You’ll encounter isopleths across meteorology (isobars joining equal air pressure), geology, and environmental science, but the underlying principle is always the same as on a topo map.
Have any questions?
Contact the experts today!
🧱 The 5 Key Rules of Contour Lines
Once you understand these five rules, contour lines go from looking like a tangle of squiggles to telling a clear story about the land.
First, contour lines never cross each other. If two lines crossed, it would mean a single point had two different elevations at the same time, which is physically impossible (overhanging cliffs are the one rare exception, and they use specialist symbols). Second, every contour line is a closed loop. A line may run off the edge of a map sheet, but if you could see the full picture it would always complete a closed circuit, because every line of equal elevation eventually loops back to where it started.
Third, closely spaced lines indicate a steep gradient, while widely spaced lines indicate a gentle slope, the closer together the lines, the faster the land is climbing or dropping. Fourth, when a contour line crosses a valley or stream, it bends to form a V-shape or U-shape that points upstream (uphill), away from the valley floor. This is how you identify watercourses and drainage channels on a contour map. Fifth, the elevation difference between any two adjacent contour lines is the contour interval, and this value stays consistent throughout a single map, so if the interval is 5 metres, every line you step over represents exactly 5 metres of height change.
💡 How to Read Contour Lines on a Map
Before anything else, check the map legend for the contour interval. This single piece of information, whether it’s 1 metre, 5 metres, or 10 metres, is the key to interpreting everything else on the map. Without it, you can’t calculate real elevation differences or slopes.
Next, locate the index contours and read their elevation labels to orient yourself on the terrain. From there, count intermediate contours between two index lines to work out the height of any unlabelled line. As you scan across the map, pay attention to spacing: tight bundles of lines mean you’re looking at something steep, while lines spread far apart represent open, relatively flat ground — useful at a glance when you’re assessing a site for a building project.
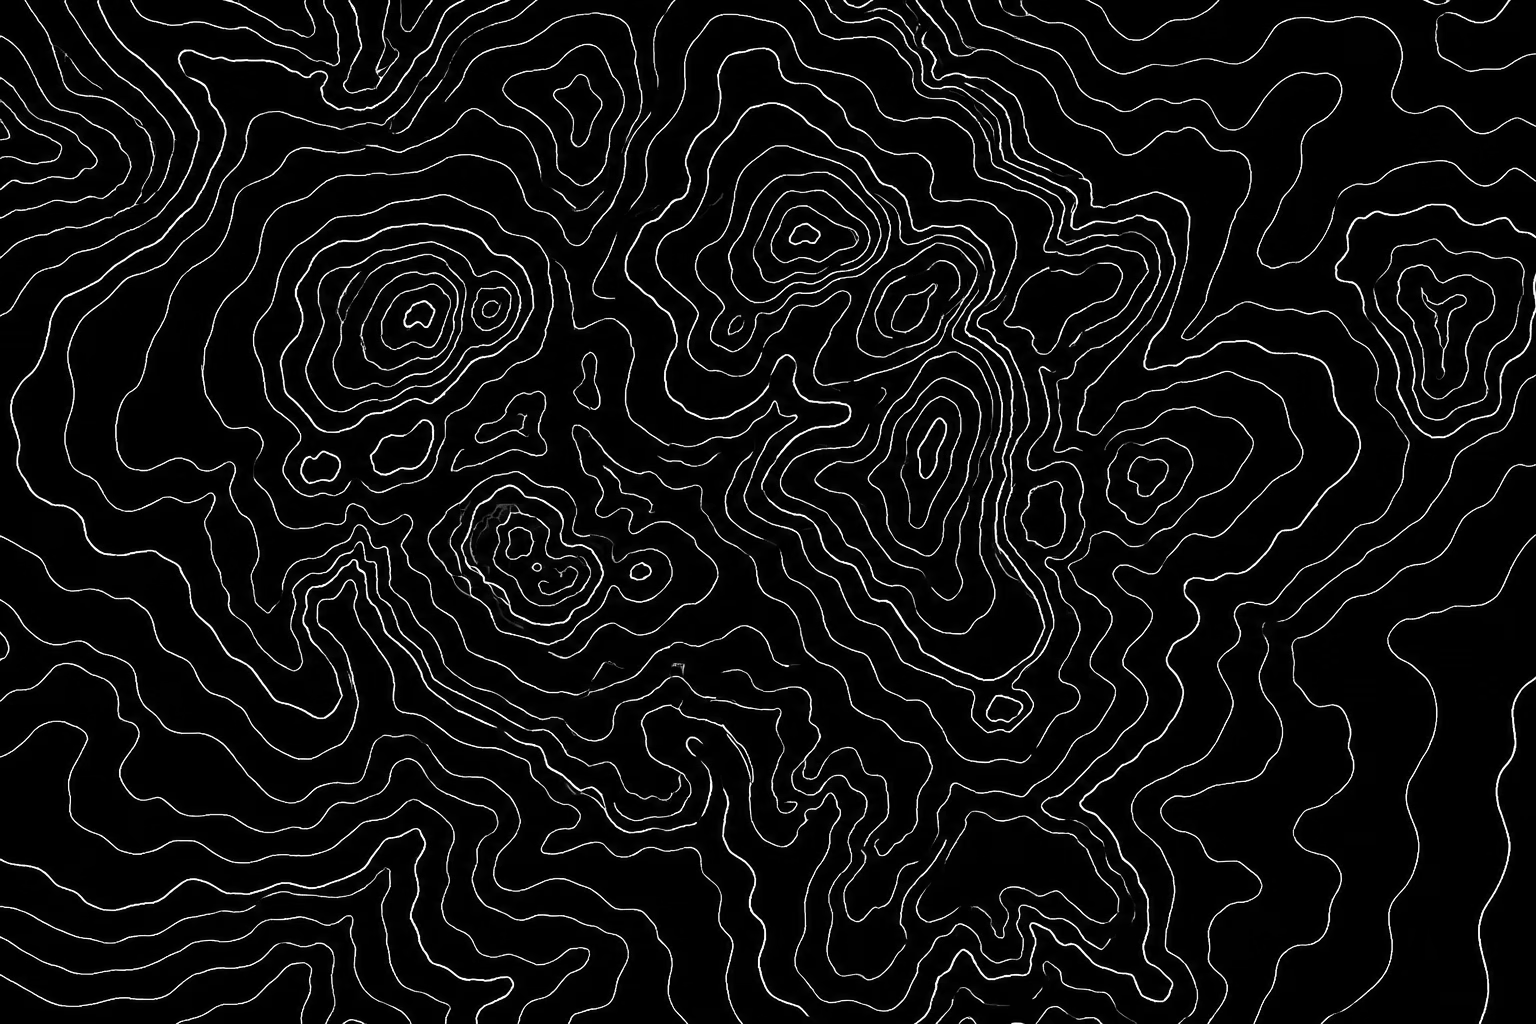
Finally, practise reading the shapes. Concentric closed loops, each one inside the next with increasing elevation, indicate a hill or summit. Elongated loops that extend in one direction indicate a ridge. V- or U-shaped bends pointing uphill indicate valleys and drainage channels. Once these patterns become familiar, reading a contour map becomes almost instinctive.
💡 Determining Gradient from Contour Lines
Gradient is simply the relationship between vertical rise and horizontal distance, rise over run. To calculate it from a contour map, you need two pieces of information: the contour interval (your vertical rise per line) and the map scale (which converts the distance between lines on the map into a real-world horizontal distance).
For example, if your map has a 1:1,250 scale and a 1-metre contour interval, and two adjacent contour lines are 8 mm apart on the map, the real horizontal distance between them is 10 metres (8 mm × 1,250 = 10,000 mm = 10 m). The gradient is therefore 1 m rise over 10 m run, a 1-in-10 slope, or roughly 10%. On a contour map, a 1-in-10 slope looks noticeably steep; a 1-in-50 slope looks almost flat, with lines spread far apart.
Gradient matters enormously in engineering and construction. It affects how surface water drains away from a building, what kind of foundations are appropriate, whether a shared access route is viable, and how much earthworks or retaining structure a scheme might need. Understanding the slope early in a project can save significant time and cost later.
💡 Contour Lines in Engineering and Construction Surveys
When a professional topographic survey is carried out on a site, whether by traditional total-station surveying, GPS, or drone, the result is a detailed set of measured spot heights across the land. These spot heights are then processed to generate contour lines at a defined interval, giving engineers and designers a precise, scaled picture of the existing terrain.
At Paddick Engineering, reviewing contour data is a core part of our land appraisals and feasibility assessments. Before a single design line is drawn, we look at what the topography tells us about drainage flows, potential flood risk, foundation requirements, and access gradients. For residential sites, whether a single house extension or a multi-plot development, understanding the contours early means we can flag constraints and opportunities before they become expensive surprises.
Contour information directly shapes drainage design, highways layout, and flood risk assessment on any site we work with. If you’re a homeowner receiving a site survey drawing for the first time, or a developer appraising land for the first time, the contour lines are one of the most important layers to understand. They’re not just background decoration, they’re a record of how water, load, and access will behave on your specific piece of ground.

Frequently Asked Questions About Contour Lines
If you’re looking at a site and want to understand what the contour data means for your project, we’re happy to help. Get in touch with the Paddick Engineering team for a friendly chat about your land appraisal or survey needs, we’ve been making sense of challenging sites for over 45 years.
What are contour lines?
Contour lines are lines on a map that connect all points at the same elevation above a reference datum. Together they create a two-dimensional representation of three-dimensional terrain, showing the shape, slope, and height of the land.
What is a contour line (definition)?
A contour line is a single line on a topographic map along which every point shares an identical elevation. It is a type of isopleth, a line connecting points of equal value, applied specifically to height above a reference level.
What are the 4 types of contour lines?
The most commonly recognised types are index contours (bold, numbered lines), intermediate contours (standard lines between index contours), supplementary or form contours (dashed lines on flat terrain), and depression contours (lines with tick marks pointing inward, indicating a hollow or enclosed low point).
What are the 5 rules of contour lines?
The five rules are: contour lines never cross; every contour line is a closed loop; closely spaced lines indicate steep slopes while widely spaced lines indicate gentle slopes; contour lines form a V-shape pointing upstream when crossing a valley; and the contour interval, the elevation difference between adjacent lines, remains constant throughout a single map.
How do contour lines show hills and mountains?
Hills and mountains appear as concentric closed loops on a contour map, with each successive inner loop representing a higher elevation. The more tightly packed the loops, the steeper the hillside; a single small loop at the centre marks the summit.
How do you determine gradient from contour lines?
Divide the vertical rise (the contour interval multiplied by the number of lines crossed) by the horizontal distance (measured on the map and converted using the map scale). The result gives you the gradient as a ratio or percentage, for example, 1 m rise over 10 m run equals a 1-in-10 or 10% slope.
How are contour lines made or surveyed?
Contour lines are generated from measured spot heights collected by surveyors using total stations, GPS equipment, or drone surveys. These height measurements are processed digitally to interpolate lines of equal elevation at a chosen contour interval, producing the finished topographic drawing.
Why do contour lines matter for a building or extension project?
Contour data reveals how water drains across a site, where slopes may require retaining structures or special foundations, and whether access routes are feasible, all of which affect design, cost, and planning. Reviewing contour information early is a core part of a thorough land appraisal or feasibility assessment.